135 Boot Ranch Ridge, Fredericksburg, TX 78624 - Gillespie County
Boot Ranch - Best destination in the Hill Country. SWPRE Fredericksburg
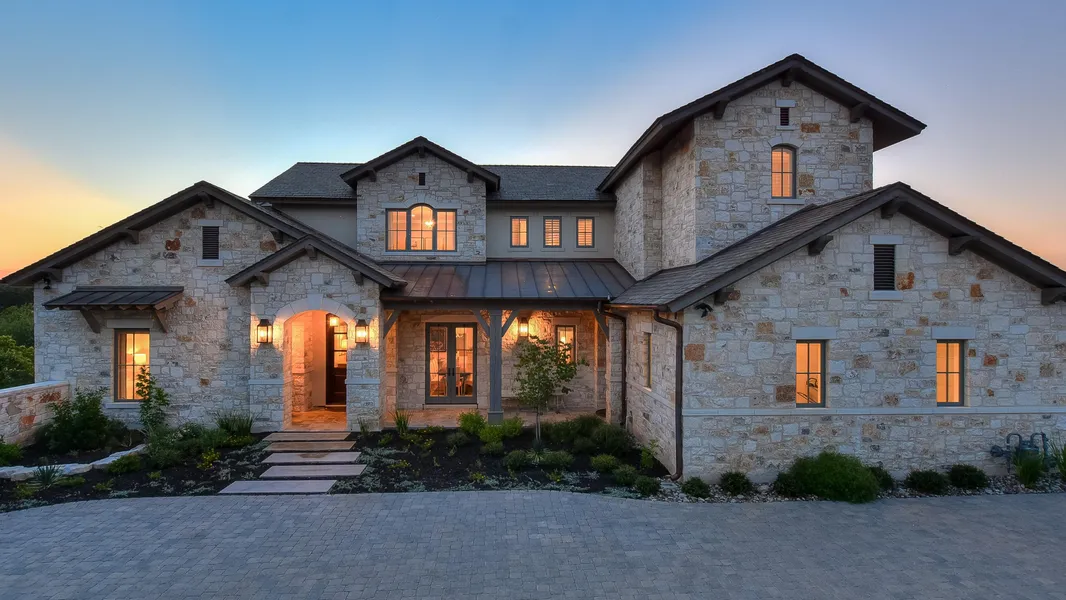
New golf course home. Turn key with decorator furnishings. 4 bedrooms, 4 baths, 2 half baths. 3 car garage. 4 porches. Infinity edge pool, hot tub, fire pit. Great Room with fireplace and wet bar open to professional kitchen with Wolf and Sub Zero appliances. Elevator, engineered hardwoods, upstairs game room with balcony. 1.93 acres on golf course. Landscaped, sprinklers, cobblestone drive, fountain, security lighting. Club membership conveys. Guard gated. Private golf course. 5 MI to Downtown.
BOOT RANCH
Ranked in Top 5 Private Texas Courses
Luxury Living Unique to the Hill Country
In the Fredericksburg MLS, Austin MLS & San Antonio MLS for residential listings by subdivision, Boot Ranch has:
Most expensive homes
Most expensive lots
Highest avg. sale price per Home SF
Highest avg. sale price per lot acre
GRAPHICS PACK (DATA & MAPS)
The Graphics Pack consolidates key information about this property including:
Outstanding Fredericksburg ISD schools
Google Maps
1.4 MI from Boot Ranch Entrance at RR-965
5 MI from Boot Ranch Entrance at RR-965 to Downtown Fredericksburg
37 MI from Llano
54 MI from US-281 at TX-71 west of Spicewood
77 MI from Downtown San Antonio
83 MI from Downtown Austin
PROPERTY DATA
All data from the Gillespie Central Appraisal District unless noted
Address: 135 E BOOT RANCH RDG
Owner: HOULDEN, J
Legal: Property ID 103677 | Geographic ID S0142-0000-009630 | Legal Description BOOT RANCH #1 LOT 96C, 1.93, -HOMESITE-
Land: 1.93 acres | 84,070.8 SF | 0.781 hectares* | 7810.433 m2*
*Hectares & m2 calculations by SWPRE
Tax rate: 1.5884
Exemptions: HS
2017 taxes with exemptions: $30,065.24
2017 taxes without exemptions: $30,351.78
Home HVAC: 4,456 SF
Utility Room: 82 SF
Attached Garage: 1,050 SF
4 Open Porches: 941 SF
Patio: 703 SF
Pool: 402 SF
Hot Tub: 34 SF
Year built: 2015 for Home, Attached Garage & Open Porches. 2016 for all other improvements
FREDERICKSBURG TOURIST & MARKET DATA
Visitors with $100K+ avg. household income: 44%
Visitors NOT from Texas: 30%
Sales tax trend: 7.3% annual increase 2016 2021
Gillespie County residential sales: 19% HIGHER 2016 vs. 2015
Gillespie County lodging receipts: 8% HIGHER 2016 vs. 2015
Fredericksburg labor force growth in 2016: 80% HIGHER vs. Texas
December 2016 unemployed residents: 70% LOWER vs. Texas
Fredericksburg annual tourist estimate: 2,000,000+ by 2021
WHO LIVES IN FREDERICKSBURG?
SWPRE provides demographics based on ESRI Tapestry Segmentation instead of tables of data. Tapestry segmentation provides an accurate, detailed description of Americas neighborhoods U.S. residential areas are divided into 67 distinctive segments based on their socioeconomic and demographic composition then further classifies the segments into LifeMode and Urbanization Groups.
53.8% are Midlife Constants
15.7% are Empty Life Nesters
14.0% are Old and Newcomers
9.4% are Retirement Communities
PUBLIC SCHOOLS ATTENDED
All assigned public schools are within 5 miles.
Fredericksburg Elementary School
6 of 10 Greatschools rating
Fredericksburg Middle School
7 of 10 Greatschools rating
Fredericksburg High School
5 of 10 Greatschools rating
Public schools attended have a direct impact on property values AND on demand. The decision for each client is different and be very complex. SWPRE makes it simple for our clients. For more information about schools and their impact on property values and demand, see Dedicated Property Website for links to : "How much do schools affect real estate prices?" and "Real value of public schools."
COMPARATIVE DEMOGRAPHICS
SWPRE utilizes socio-demographic data from Certified Commercial Investment Member (CCIM) and ESRI. SWPRE Big Data analyzes ESRI and CCIM data to generate comparative socio demographic graphics comparing Fredericksburg to Austin, Dallas, Houston and San Antonio.
Fredericksburg socio-demographic key findings:
High home values: In several key categories
Very high household (HH) income: Ranks #1 in avg. annual income growth
Extremely high HH net worth: Ranks #1 by almost 200%
Established residents: 48 year old median age
Fredericksburg ranking compared to Austin | Dallas | Houston | San Antonio in:
Income
#1 Avg. Annual % Income Growth
#1 Annual % Income Growth $100K $150K
#1 Annual % Income Growth $200K+
Highest Net Worth
#1 Avg. Household Net Worth
#1 Household Net Worth % $250K $500K
#1 Household Net Worth % $500K +
Homes
#2 Avg. Home Values
#1 Home Values % $200K $400K
#2 Home Values % $400K $500K
From elevation to risk assessment
Search for detailed parcel information including; Elevation & Vegetation Maps, Ownership Information, Detailed Parcel Information, Crop History Map, Soil Survey Productivity Data, and more.
Research Parcel InformationEnvironmental Factors
Resources
More Land for Sale in Gillespie County
Gillespie County Properties By Type
- Ranches for Sale in Gillespie County, Texas
- Farms for Sale in Gillespie County, Texas
- Riverfront Property for Sale in Gillespie County, Texas
- Undeveloped Land for Sale in Gillespie County, Texas
- Lakefront Property for Sale in Gillespie County, Texas
- Residential Property for Sale in Gillespie County, Texas
- Hunting Land for Sale in Gillespie County, Texas
- Recreational Property for Sale in Gillespie County, Texas
- Horse Property for Sale in Gillespie County, Texas
- Commercial Property for Sale in Gillespie County, Texas
- Timberland for Sale in Gillespie County, Texas
- Beachfront Property for Sale in Gillespie County, Texas
Properties for Sale Nearby Counties
Gillespie County Properties By City
- Doss, Texas Land for Sale
- Fredericksburg, Texas Land for Sale
- Harper, Texas Land for Sale
- Stonewall, Texas Land for Sale
- Willow City, Texas Land for Sale
- Albert, Texas Land for Sale
- Blumenthal, Texas Land for Sale
- Cherry Spring, Texas Land for Sale
- Morris Ranch, Texas Land for Sale
- Spring Creek, Texas Land for Sale
- Tivydale, Texas Land for Sale
- Cain City, Texas Land for Sale
- More